
Creating a Pivot Table in Excel is one of the easiest ways to monitor data like driver/vehicle breakdowns, how much you spend on each product, and your billing by state, invoice, and date. To help your team organize the fuel card data from your invoice, this blog will walk you through the steps to creating the most popular pivot tables used by our clients. If you don't currently use a card program, learn more about fleet fuel cards.
Create a pivot table for your fuel card data.
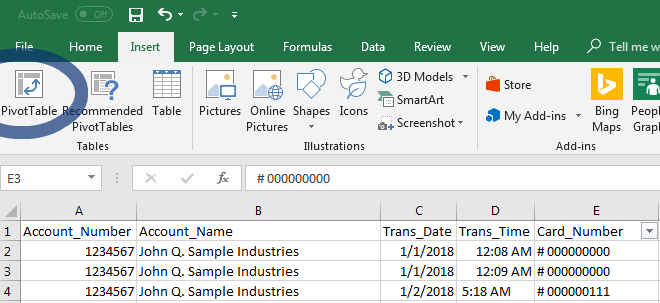
Open your latest invoice in Excel, then select the “Insert” Tab at the top of the page. The option to create your pivot table will be on the far left of your screen, circled below.
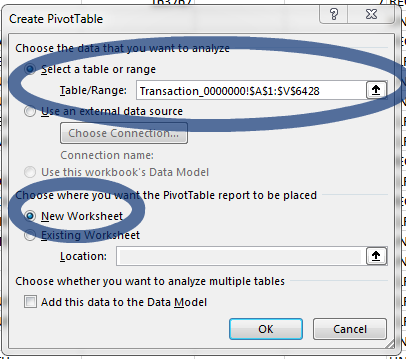
Click the “Pivot Table” button and a new window will pop up asking for specific instructions. For the first question, hit “Select Table or Range” and highlight your entire invoice.
For the second question, select “New Worksheet.”
When you hit “Ok” a new worksheet will open in your Excel File. The fields from your workbook will appear on the right hand side of your screen. You can drag these fields into the correct box depending on the goals of your report, and we have included some client favorites to get you started.
The fields you select will depend on the goals of your pivot table. We will walk you through a few of the most popular metrics that our customers use, but the possibilities are truly endless!
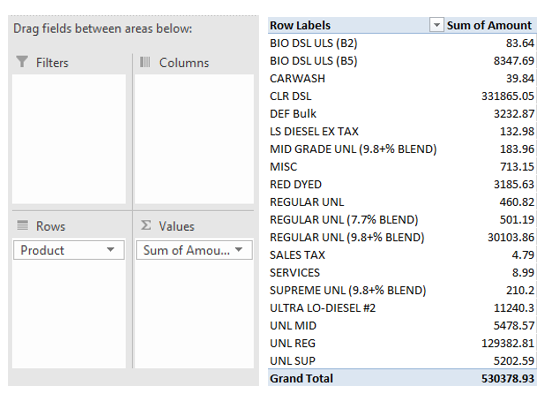
Track your total spend per product.
If your company is curious about your diesel versus gasoline spend, how much you pay in fuel taxes, or how much off-road diesel or dyed diesel you’ve purchased, Excel can create a breakdown in a few seconds.
To create this pivot table, drag the “Product” field into the Rows box, then drag your “Amount” field into the Values box.
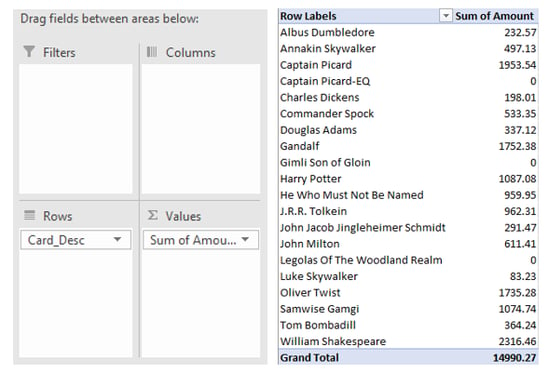
Track your total spend per driver.
As a manager, it is essential to categorize your fuel card spend per driver and monitor for inconsistencies. Fortunately, Excel’s Pivot Tables can be setup quickly.
To create this pivot table from your fuel card data, drag the “Card_Desc” field into the Rows box, then drag the “Amount” field into the Values box. This will display a side-by-side comparison of each driver and their spending for the month, allowing you to check for errors or overspending.
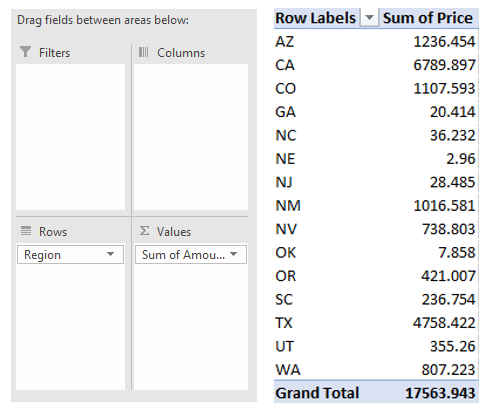
Track your total spend by state.
If you operate across the United States, organizing your invoice by State can help determine travel patterns and even your tax liability for each region.
To create a pivot table that sorts by state, drag the field “Region” into the Rows box and “Amount” into the values box.
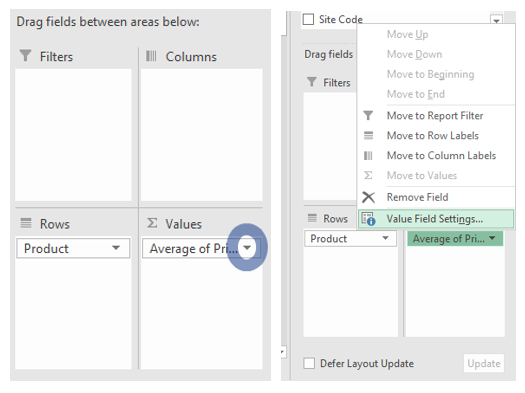
Calculate your average price per gallon from your fuel card data.
For some managers, tracking the average price paid per gallon is an essential part of their monthly workload. To generate a quick and easy Price Per Gallon report, you can create a pivot table from your P-Fleet reports.
To generate a PPG report for different products, drag the “Product” field into the rows box. Then drag the “Price” field into the Values box. The standard formula will default to the sum, instead of the average. To change this setting, click on the arrow to the left of the “Sum of Price” field. From there, a pop-up menu will allow you to select “Value Field Settings.” Click on the Average option and generate your new pivot table.
For more information, check out Microsoft’s comprehensive page on Pivot Tables.
Conclusion
Pivot tables are a vital tool for managers and accounting teams, as they extrapolate your fuel card data trends with a few quick clicks. Though these are the most popular pivot tables that our clients use, you can adjust the formulas to track whatever metrics are important for your business.